In the program one can make easily selections on refitting data, such as type, length, group etc. The result of the selection will be displayed on the distribution map and density map. The length can be studied in either a trace line or histogram. And the orientation of the lines can be shown in a sector graph. In ANALITHIC III spatial selections for refits can be made in various ways, e.g. one can study the lines going from one area to another. Every thinkable combination of lines and areas (polygons) can be made in selections.
The structure of a group can be studied in a so called ‘refitting diagram’. This is a schematical representation of the artefacts and their type of connections.
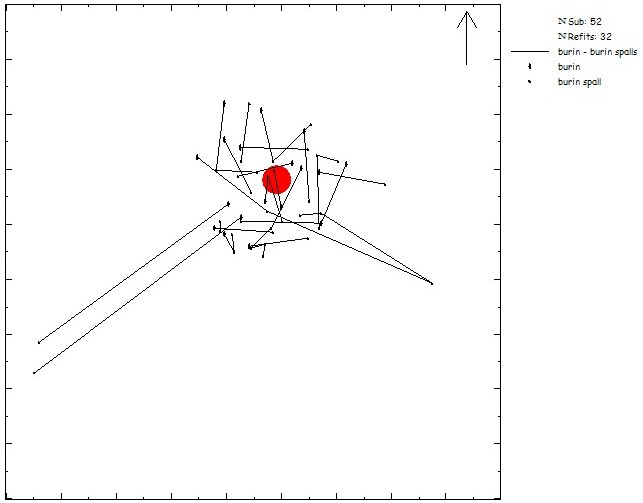
Pincevent unit T112: distibution map of refitting lines between burins and burin spalls.
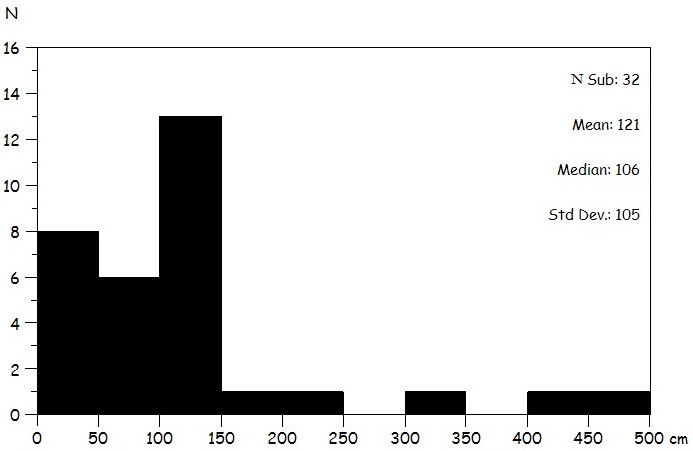
Pincevent unit T112: histogram showing the length of refit lines between burins and burin spalls.