ANALITHIC offers many options to create powerful distribution maps. Below the essentials will be described.
A dristribution map dsiplays artefacts and refits by using symbols and types of line. The symbols can be attached to all relevant fields. Likewise colors can be attached to fields. Besides this the size of the symbols may be calculated on the basis of the size of the artefact.
There is drawing module to draw borders, features, and analytical areas. These areas may be used for spatial selections.
There are more options to shape the map, like a north arrow, density grid, ring & sector systems. Furthermore one may zoom in and out. The legend is fully automatic for types and colors and is based on the actual selections of refits and artefacts. The reference count for every category may be displayed.
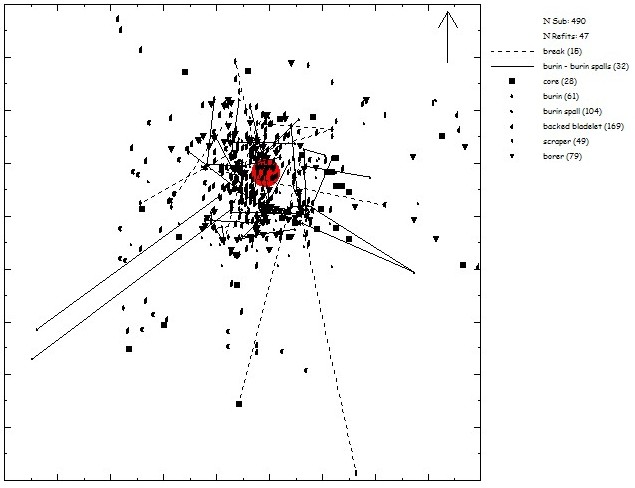
Pincevent unit T112: all artefacts and refit lines. In the center the hearth is indicated by a red circle.
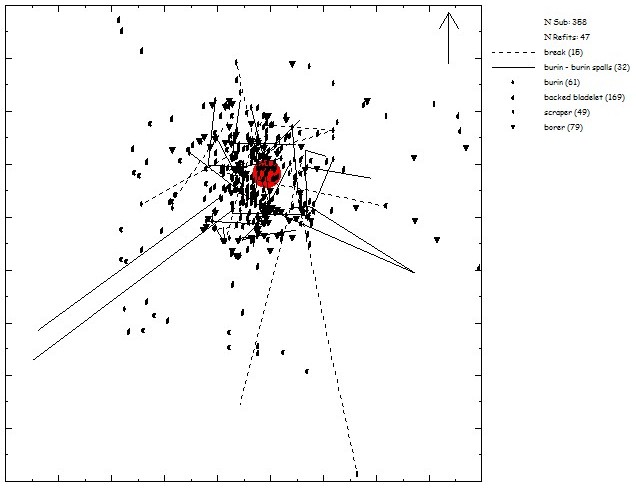
Pincevent Unit T112: all tools and their associated refit lines.
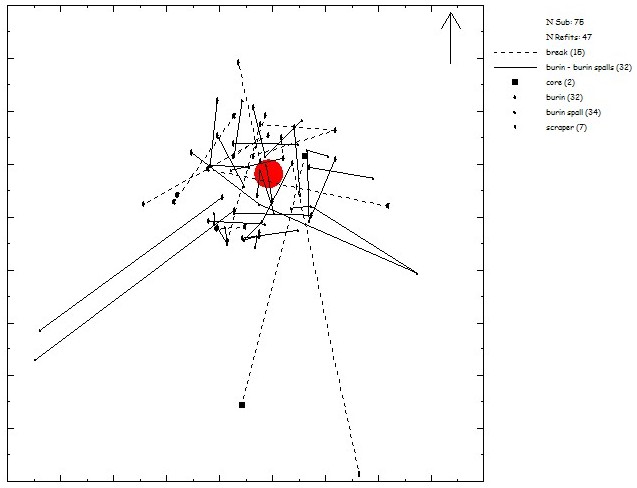
Pincevent Unit T112: all refits and the connecting artefacts.